Review GPU usage
See what each GPU in the cluster was used for, how model requests reach the GPUs, and the demand on each GPU queue.
Administration → GPU usage shows how the cluster's GPUs are used over a time window: which workloads held each GPU and how busy it was, how requests spread across the replicas of each model deployment, and what each tenant's GPU queue is guaranteed and waits for. Platform administrators use it to find idle or overloaded GPUs and tenants waiting for capacity. GPU spend in BCU is in Review tenant usage.
Before you begin
Only platform administrators see this page: it requires platform.global.read. It shows workloads of every tenant by namespace and pod name. It shows no prompts, responses, or model inputs.
The page reads the cluster's GPU, model-server, and KAI Scheduler metrics from the platform's Prometheus. A figure the cluster does not collect shows as missing, never as zero. For example, a MIG slice or a GPU without GPU metrics has no utilization or memory figures.
Open GPU usage
- Open the workspace switcher and choose Administration.
- Select GPU usage in the Platform section of the sidebar.
- Choose the Window: Last hour, Last 6 hours, Last 24 hours, Last 7 days, or Last 30 days.
Refresh reads the figures again. Below the window, the page states the time range, how often it was sampled, and the utilization at which a GPU counts as busy.
When a whole kind of metric is not collected, a notice names it: GPU metrics missing, Model metrics missing, Queue metrics missing, or Queue demand missing.
GPUs
The GPUs tab lists each GPU node, with its GPUs below it. A node row adds up its GPUs, and shows how many GPUs the node advertises to Kubernetes, how many its pods request, and how many report metrics. A node that reports no GPU metrics shows No GPU metrics. MIG slices are listed under their GPU as MIG with their profile.
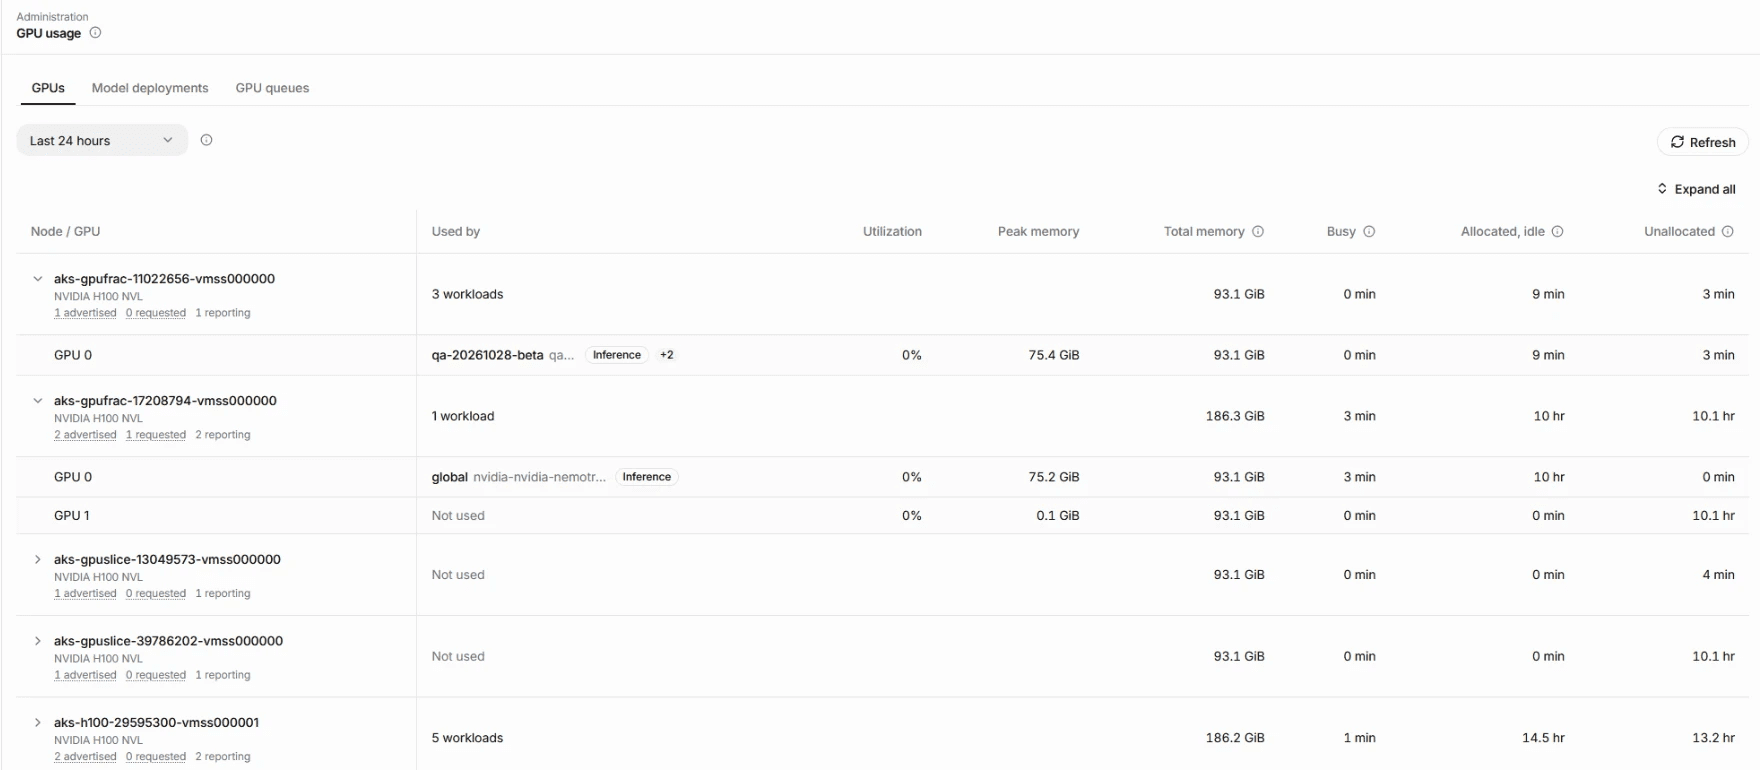
| Column | What it shows |
|---|---|
| Node / GPU | The node, or the GPU and its model |
| Used by | The pods that held the GPU in the window, with their namespace and how long each held it. Not used when no pod held it. |
| Utilization | Average utilization of the GPU over the window |
| Peak memory | Highest GPU memory in use |
| Total memory | Memory of the GPU |
| Busy | Time a pod held the GPU at or above the busy threshold |
| Allocated, idle | Time a pod held the GPU below the busy threshold |
| Unallocated | Time no pod held the GPU |
Expand all and Collapse all open or close every node. Selecting the workloads in Used by lists who used the GPU, each marked Inference, Training, or Other.
A high Allocated, idle time points at a deployment that holds a GPU it does not use. A high Unallocated time is capacity no workload claims.
Model deployments
The Model deployments tab lists each model deployment, with its replicas below it. A deployment row adds up its replicas.
| Column | What it shows |
|---|---|
| Deployment / replica | The model and its namespace, or one replica pod |
| Node | The node the replica runs on |
| Share of requests | The replica's part of the deployment's requests |
| Requests | Requests the replica served in the window |
| Running (avg) | Average number of requests being processed at once |
| Waiting (avg) and Waiting (peak) | Average and highest number of requests queued in the model server |
| GPUs | GPUs the replica requests |
A replica with a much larger share of requests, or with requests waiting while others idle, shows uneven routing.
GPU queues
The GPU queues tab lists the KAI Scheduler queues. A tenant's queue holds its guaranteed GPUs; its inference and training queues hold its workloads. See Tenant GPU scheduling.
| Column | What it shows |
|---|---|
| Queue and Tenant | The queue, and the tenant it belongs to. Shared marks a queue that belongs to no tenant. |
| Workloads | The kind of workload the queue holds, or All |
| Guaranteed | GPUs guaranteed to the queue: the tenant's Guaranteed GPUs on its Quotas tab. Unlimited where no limit applies. |
| Fair share | GPUs the scheduler would give the queue at the current demand |
| Allocated | GPUs the queue's workloads hold |
| Requested | GPUs of the queue's running and waiting workloads |
| Waiting and Peak waiting | GPUs of workloads not placed yet, on average and at the highest point |
| Workloads waiting | Number of workloads not placed yet |
A tenant whose workloads wait while its allocation is below its guarantee needs attention on the cluster. A tenant that waits at its guarantee needs a larger GPU allocation, or more GPUs in the parent queue.
Read GPU usage through the API
GET /v1/gpu-usage returns the same figures. It requires platform.global.read and takes the window as start and end, each a timestamp with a time zone. An end in the future reads as now.
export BSQAI_API_URL=https://<api-host>
export ACCESS_TOKEN=<platform-administrator-access-token>

curl -s -G "$BSQAI_API_URL/v1/gpu-usage" \
  -H "Authorization: Bearer $ACCESS_TOKEN" \
  --data-urlencode "start=2026-10-28T00:00:00Z" \
  --data-urlencode "end=2026-10-29T00:00:00Z"
The answer holds start, end, step_seconds, the busy threshold idle_below_percent, signals with whether each kind of metric was collected, and the nodes, deployments, and queues. A figure the cluster does not collect is null, never 0.
| Error | Cause |
|---|---|
400 gpu_usage_window_invalid | start or end has no time zone, or the window spans less than a minute or more than 31 days. param names the field. |
503 gpu_usage_unavailable | The BSQAI API has no Prometheus address for GPU usage, or cannot read it right now. Retry shortly. |